Brochures & Reports


BROCHURES & REPORTS
Using:
THE BRIEF
Creating compelling reports required balancing heavy text and detailed data with engaging visuals. Each report had to cater to its specific purpose, whether showcasing achievements, presenting data findings, or delivering annual reviews, while remaining cohesive and visually appealing.
THE PROCESS
My approach began with thorough content analysis to identify key information hierarchies and narrative structures. This informed decisions about layout, pacing, and visual emphasis throughout each document.
Working closely with the authors, I developed visual treatments that would enhance understanding while creating natural rhythm and flow within dense information. Particular attention was paid to creating consistent visual language across different types of data representation.
THE SOLUTION
I transformed complex information into visually engaging layouts using a strategic combination of:
Clean, hierarchical typography that guided readers through different information levels
Custom infographics that translated complex data into digestible visual stories
Strategic use of colour and space to create visual breathing room and emphasis
Consistent visual language that unified diverse content types
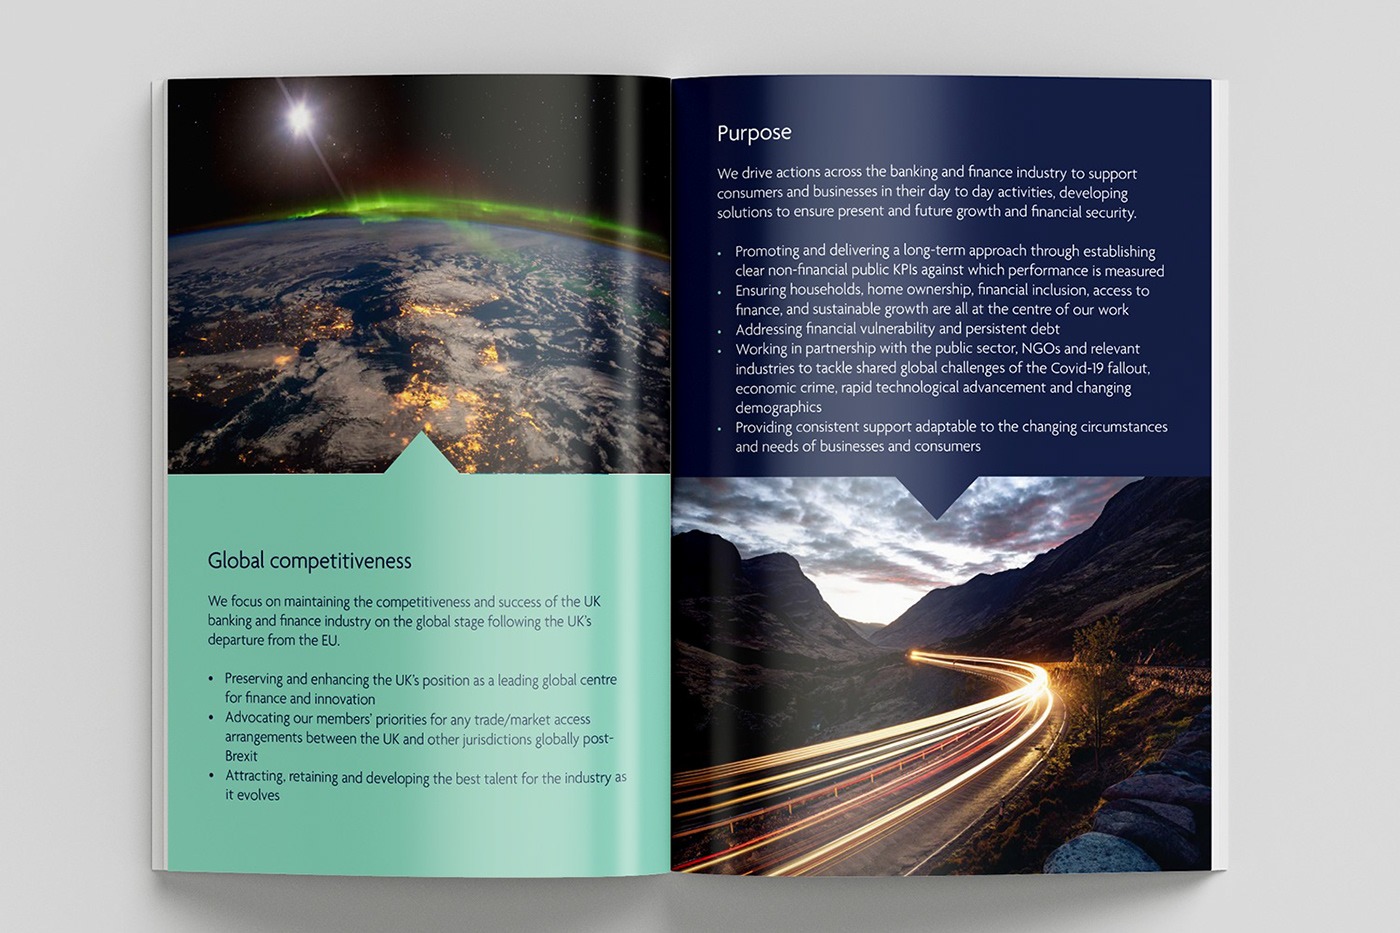
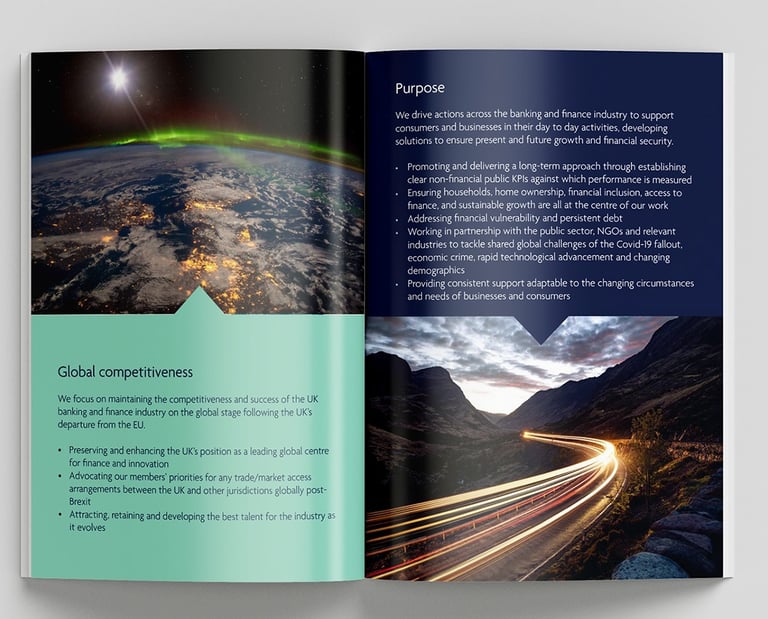
Thoughtful integration of photography and illustration to support key messages
Each report was designed with both comprehensive reading and quick scanning in mind, ensuring the information was accessible regardless of the reader's approach or available time.
THE RESULTS
The redesigned reports achieved significant improvements:
Increased readership and engagement compared to previous text-heavy formats
Enhanced comprehension of complex data and concepts through visual explanation
More effective communication of key achievements and findings
Improved perception of the organisations producing the reports
Greater likelihood of reports being shared and referenced
By applying thoughtful visual storytelling principles, the reports successfully balanced informational depth with accessibility, transforming potentially dry content into engaging, effective communication tools.
NEXT